Initial Data Analysis
Emi Tanaka
Fonti Kar
Australian National University
2025-07-14
Data Analysis
- Data analysis is a process of cleaning, transforming, inspecting and modelling data with the aim of extracting information.
Exploratory data analysis
- EDA is about exploration and discovering unknown insights.
- Flexible, iterative, visual for discovering, identifying, or formulating hypothesis.
“EDA is an attitude, a flexibility, and a reliance on display, NOT a bundle of techniques.” – Tukey (1980)
Confirmatory data analysis
- CDA is to test specific, pre-defined hypotheses using statistical methods.
- Structured, rigorous, statistical for testing, assessing, or concluding.
- Often only when the data is from an experimental study with a proper experimental design.
Initial Data Analysis
- IDA is the crucial first step in analysing data, involving inspection and exploration before formal statistical analysis.
- It helps to ensure data quality, identify potential issues, and refine the analysis plan, leading to more reliable and reproducible results.
- Different name is used to describe the same process, such as:
- Chatfield (1985) as “initial examination of data”,
- Cox & Snell (1981) as “preliminary data analysis”, and
- Rao (1983) as “cross-examination of data”.
Analysis Framework
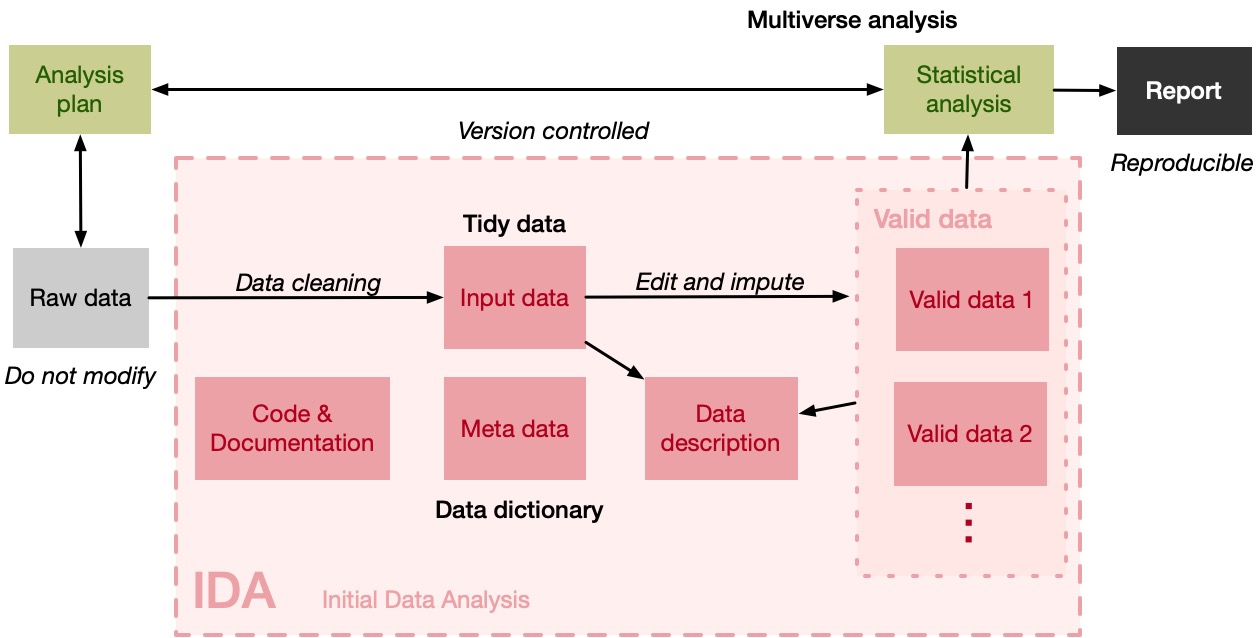
Tidy data
- Each column is a variable.
- Each row is an observation.
- Each cell is a single value.
Tools
- Git/GitHub for version control and collaboration
- Open-source programming languages (e.g. R and Python) for coding
- Quarto with markdown syntax for interoperable reproducible reports
Data Description
🎯 Aim to assess the structure and quality of the data
- A non-exhaustive list of things to check could include:
- Studying the missing data patterns
- Numerical or graphical summaries of univariate and multivariate distributions
- Does the distribution of the data imply violations of assumptions for the main analysis?
- Checking if data collection method is consistent across discrete set of variables
- Plotting the data entry order across variables
- Identifying the observational unit
- If a comparative experiment,
- Identify the experimental unit for every treatment factor
- Be aware of pseudo-replicates!
- Does the treatment group have different demographic characteristics to the control group?
- Does the experimental layout match the description match?
- In particular, are treatments randomised?
Sanity check your data
- Also referred to as data scrutinizing.
- Use common or domain knowledge to check if the recorded data have sensible values.
- For example:
- Are positive values, e.g. height and weight, recorded as positive values with a plausible range?
- If the data are counts, do the recorded values contain non-integer values?
- For compositional data, do the values add up to 100% (or 1)? If not is that a measurement error or due to rounding? Or is another variable missing?
- Are data encoded correctly?
- Use independent or external sources (quick Google or past published articles)
- Consider if or how data were derived